The L3DCube
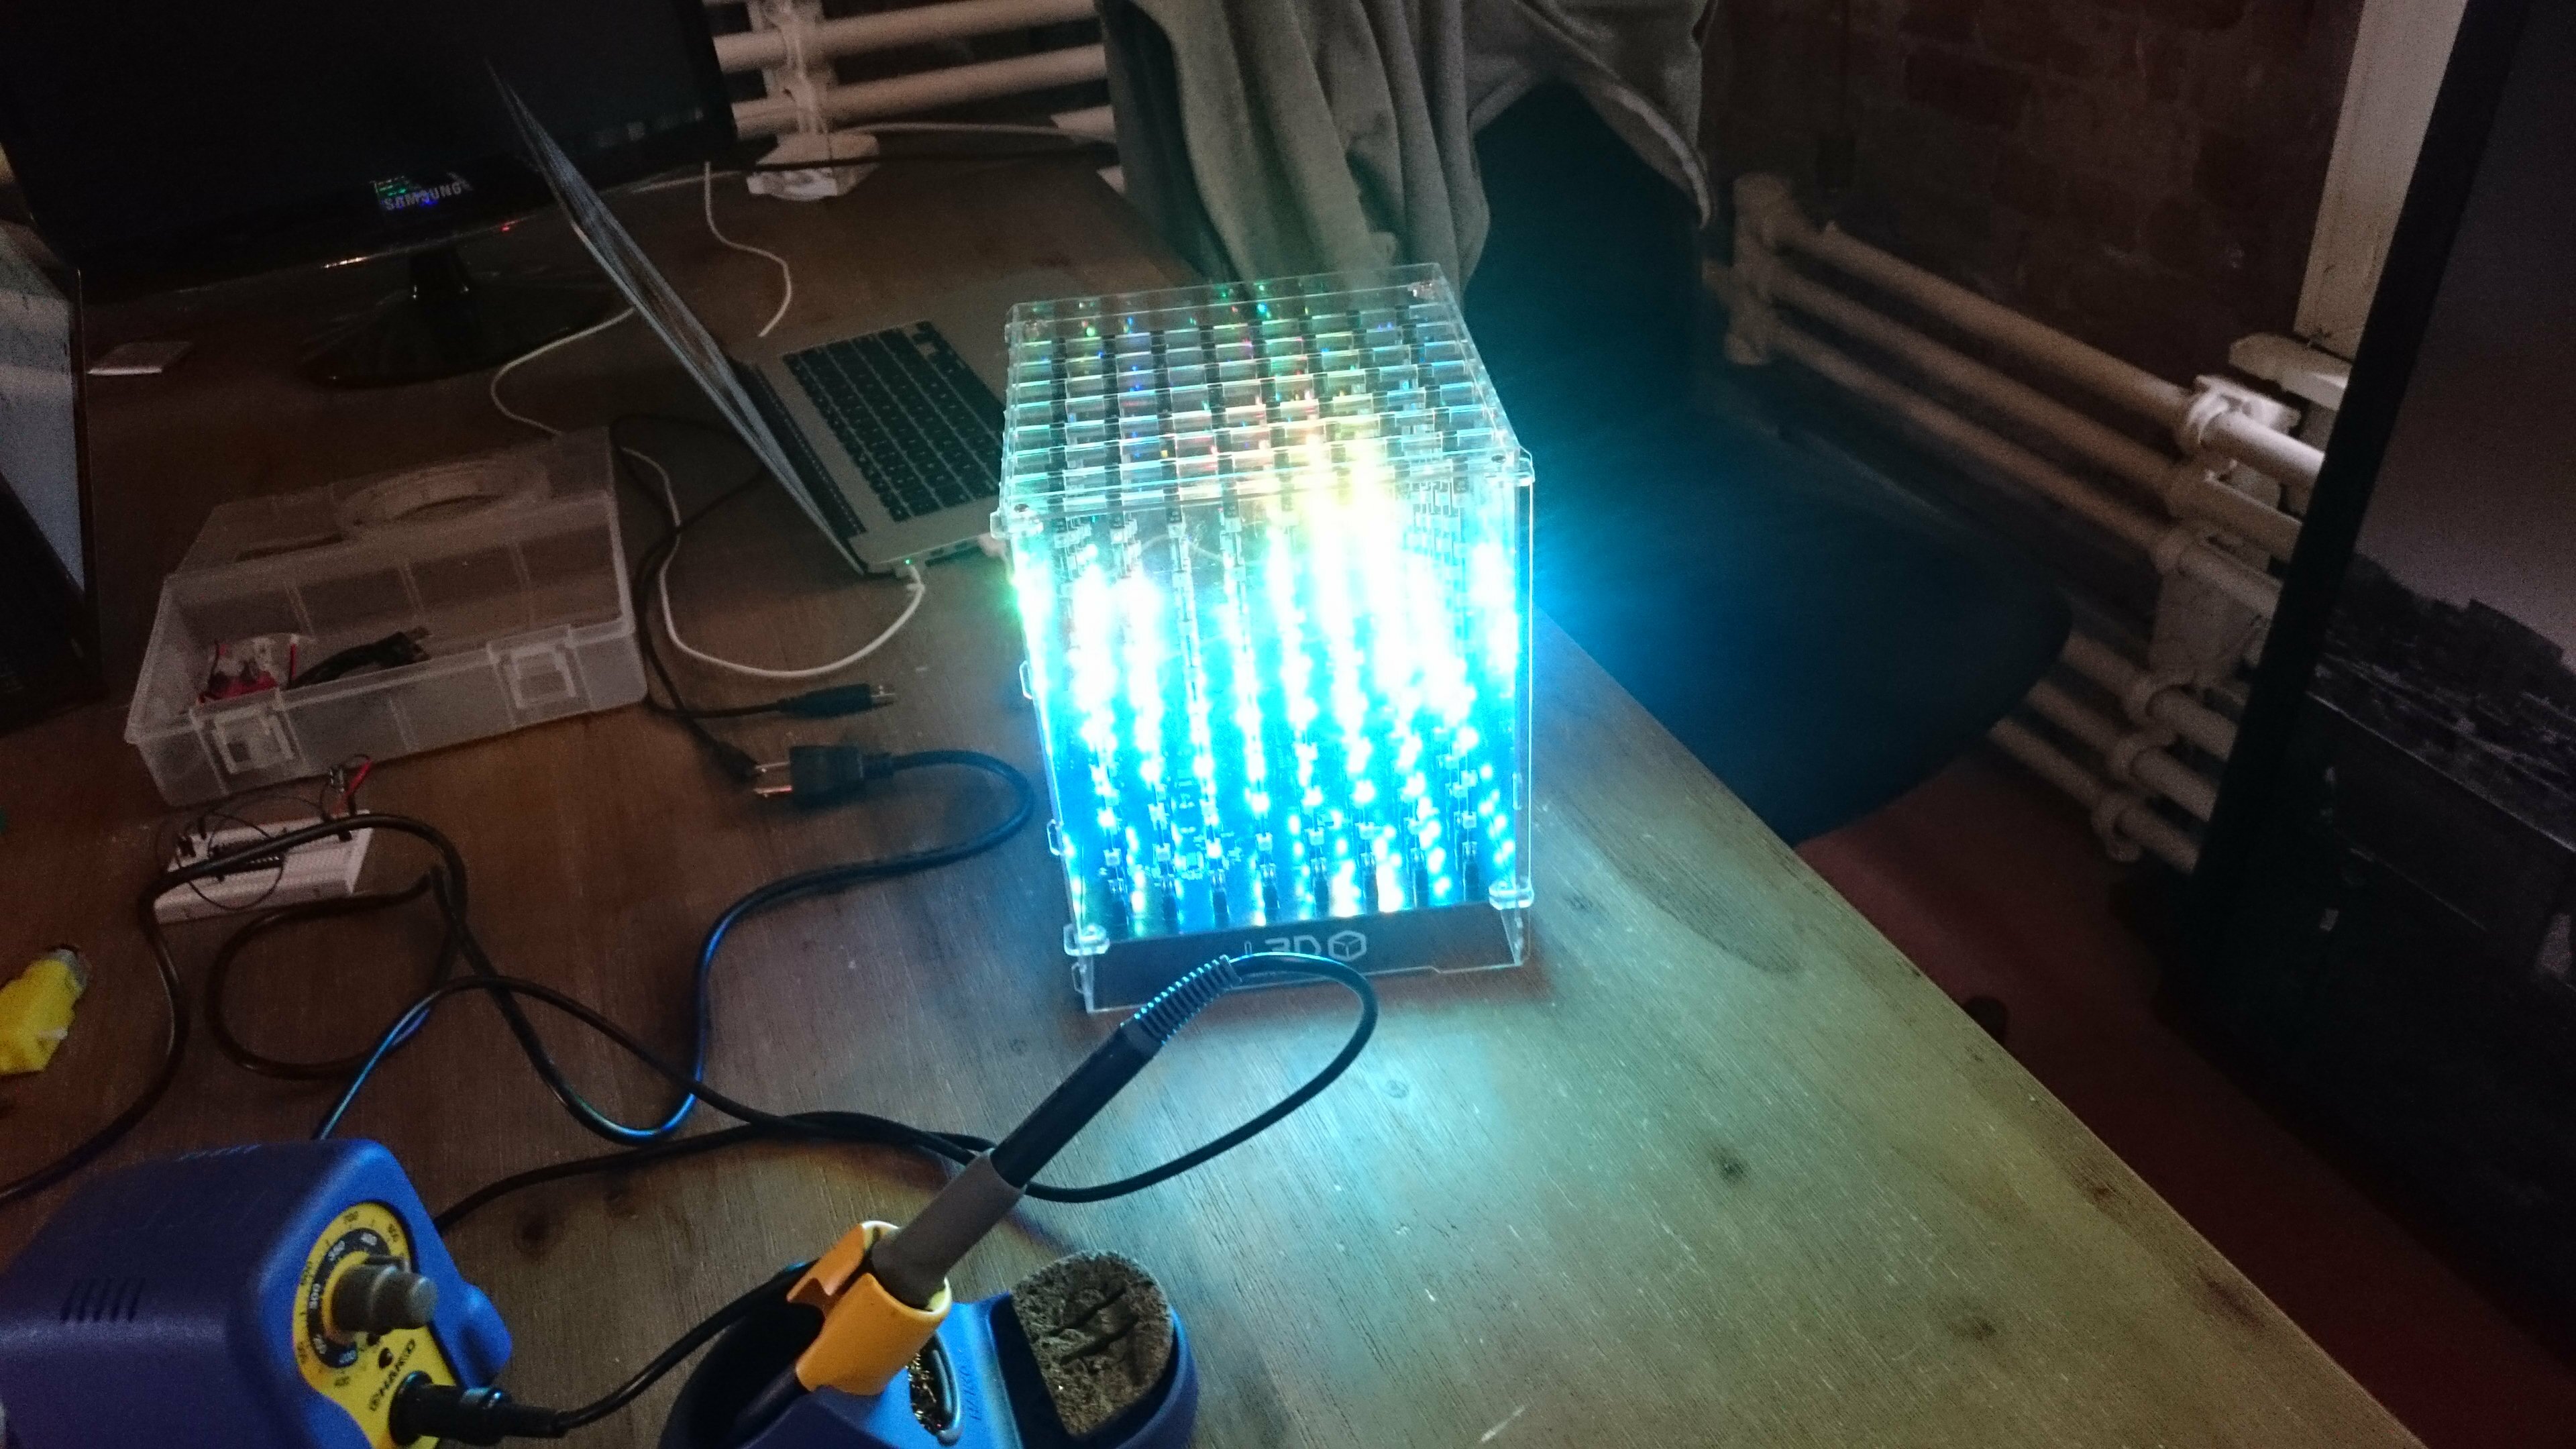
The cube falls into the category of volumetric displays, meaning that it can be used to represent 3 dimensional shapes. It is composed of 8*8*8 512 RGB LEDs, namely the very popular WS2812 that you can find in Adafruit’s neopixel product line.
It is sold by a company called Looking glass factory. It is still a product at the kickstarter stage. You can read about the story of its development on this instructable.
They make an 8*8*8 and a 16*16*16 version. The small version will set you back 399$, not something that I can afford. I was able to play for a while with the one from WearHacks. The solution for you can be even more rewarding: build your own! You can start by having a look at these Instructables.

The animations
The first thing that you notice when you start working with an LED cube is how mesmerizing it is for people. We like shiny things and pretty colors. Stack 512 of them and you have a very powerful attention grabber.
Now what are you going to do with that attention ? Having a taste for aesthetically pleasing data visualizations, I wanted to try ideas that would have efficiently transmit information while creating an interesting visual effect.
Following is the list of the 4(+1) projects I ended up working on:
- Real time scatter plot.
- Real time worldwide weather visualization.
- Webcam stream projection.
- Depth and color projection with the Kinect.
- Bonus: L3D Cube+RaspberryPi.
More details will be given below for each animation. For those of us who don’t like to read, here is a video providing an overview of the result.
Walkthrough
We only provide a general overview of the process involved to generate the animations. If you wish to reproduce this work or delve into the details, a complete tutorial is associated with each animation.
The core of the 4 animations is the same: Processing runs on the computer. It is used to collect data and transform them in colors to be sent to the Particle on the cube. When the cube has received 512 color codes, it unpacks these codes and displays the corresponding colors on its voxels.
Voxel is the contraction of Volume and Element. In our case it is a point in 3D space represented by its cartesian coordinates (x, y, z).
Real time scatter plot

I spent a long time looking for a meaningful source of real-time data that would provide a simple API to work with. I was surprised by the difficulty of the task. Besides financial data, flights informations and weather conditions, not much else. I expected something like…the amount of CO2 being generated, the ratio of renewable energy in the global energy mix, that kind of things. If you know of any interesting source please drop me a hint in the comments!
Anyhow. I ended up using a stream of data that I knew was being updated every 2 minutes: the information posted by my connected barometer to Thingspeak.
The Thingspeak channel is queried via an HTTP GET request from Processing. A Json is returned and parsed. We use these values to draw voxels representing a point in the scatter plot.
Since you might want to take a look at a plot that lies in the background, you can tilt the cube in order to shift the position of each plot. The accelerometer of Particle on the cube is used to detect a tilt.
As a follow-up, I will write a Processing library so that graphs like histograms, scatter or polar plots can be drawn on the cube with a few line of codes.
Real time worldwide weather visualization

This one is my favorite because of the problems that needed to be solved to make it work, plus it is a very good example of the use of different symbolism systems to display multi-dimensional data.
The first thing to find was a good source of data. OpenWeatherMap allows 60 calls/mn and updates its data every hour for free users. Good enough. In retrospect I might have been better off with Wunderground (their info is updated more frequently) but by the time I got to this conclusion everything was already working.
OpenWeatherMap provides a json file composed of 200k cities, their coordinates and their id. Python was used to select the cities that were to be shown on the cube. I started by transforming their coordinates. Latitude and longitude are polar coordinates, when the coordinate system of the cube is cartesian (x, y, z). Thus is transformed the coordinates of every city to their cartesian equivalent if the earth had a radius of 4 voxels.
Obviously many cities ended up on the same voxels. From these groups of cities, one was randomly selected and the result was saved in a csv file.
The csv file now composed of about 200 cities was imported to processing. The ids of each city were pasted in the proper GET request. The temperature was extracted from the json returned and transformed into a color from the appropriate gradian.
The result is quite as it should be: cold at the poles, warmer at the equator. With a lot of imagination, you can even distinguish the continents!(well, kind of…).
Finally a rotation effect was added for good measure.
Webcam stream projection

We take the video feed from a webcam as an input. The feed is analyzed frame by frame on Processing.
Each frame is cropped to a 512*512 format so that we have a nice square with the width and height values being multiple of 8 to work with.
The area of the frame is divided into 8*8 64 squares. The RGB value of the pixels in each square is averaged. The gif on the right gives an example of using 8, 16, 32, 64, 128, 258 and 512 – which gives the original resolution – subdivisions per side .
A new 8*8 frame is recreated from these averaged values. These values are used to light up the voxels on the frame of the cube facing the spectator.
As a twist, I used the frames preceding the front one to display past frames, with a delay between each refresh.
I was a bit frustrated to use a 3D display to show a 2D image. Hopefully this led to…
Depth and color projection with the Kinect

The general idea is the same as with the last animation, except that we not only map the colors but also information of the depth of the objects displayed.
We follow the same processed employed with the webcam: the average pixel values of the original image divided into 64 areas is used to recompose the color of the scene on the cube. But this time, we also make use of the depth value that the kinect provided for every pixel of the video image. The averaged value are used to recompose an 8*8 image representing the depth.
These values then determine the position of each voxel along the z axis.
Once again you will need a bit of imagination to clearly recognize the shapes on the cube.
Bonus: control the cube with a RaspberryPi!
Situations might arise when it wouldn’t be practicale to use a whole laptop to control your cube(s) system. This is where the RaspberryPi comes in handy.
It won’t drive the kinect, but for every other application this small computer will do just fine. And since you can find a version of Raspbian with Processing pre-installed over here, most of the work is already done.
The only twist comes from the fact that if you are using your raspi headlessly (without a screen), Processing will return an error as it is looking for a screen on which to display its rendering. You need to follow these steps to avoid it.
Conclusion
A lot of resolution is obviously lost on such a ‘small’ display. But imagine the same thing with an entire wall of LEDs in a volumetric fashion!
Plus the cube doesn’t have to be a cube either! Since the plans are open source, you could use it to bootstrap your own design. Until then, there still is a lot to be done with the L3DCube.
Problems encountered
According to the reference document, the L3D Processing library is supposed to offer the option to render a cube of variable dimension providing the size of each axis to the constructor like so: new L3D(this, x, y, z). It would have been a very useful feature for testing the display capabilities of different layouts for the cube. Unfortunately I run into a NullPointerException trying to use this constructor prototype. If you have any input on this, please leave a comment it will be much appreciated.
Another issue arise, this time not from the cube itself but from the Photon. It relies on a stable wiFi connection to be programmed and to receive the stream of colors from processing. Which is not something than can be insured in every situation. Example: I was unable to make a demo work during a hackathon because all the networks would redirect to a login page where the students are supposed to enter their credentials. Not something that you can do on a Photon. You can use a smartphone as a hotspot but it can get quite costly pretty fast.
A solution would be to use an Arduino Uno instead of the Photon to drive the cube, and have Processing transmit its data over Serial instead of a UDP socket but it implies modifying the L3D Cube library.
Sources
- The code used on Processing and on the cube’s particle.
- Looking glass factory: the company who makes the cube.
- CubeTube: a platform to share L3DCube visualizations.
- old.CubeTube: the old version of the website. Still contains valuable sketches.
- Processing: used to process data and send colors to the cube.
- The L3DCube Processing library used in the examples.
- An Instructable explaining the coordinate system of the cube and how to address it.
Hello! This is kinda urgent, how do you plug the arduino? The hole isn’t to small to make the socket pass?